Using Wireshark to dissect bragi messages
Managarm offers the possibility of dumping some protocols for inspection with Wireshark.
Setting it up
Bragi can generate the Wireshark dissector with a command like:
bragi -o bragi.lua ../src/managarm/protocols/posix/posix.bragi ../src/managarm/protocols/fs/fs.bragi wireshark
This command is the currently recommended way, as other protocols are currently not dumped. This generates the Wireshark Lua dissector at bragi.lua, which needs to be placed under ~/.local/lib/wireshark/plugins/, either by copying the file or symlinking. Make sure that your Wireshark has Lua dissector support enabled. The bragi dissector should be rebuilt after every change to one of the passed bragi protocols. Reloading the Lua file in Wireshark can then be done with Ctrl+Shift+L.
Dumps are collected over ostrace if it has been enabled with the ostrace kernel cmdline. This will generate a ostrace.bin in your build directory. A Wireshark-usable pcap file can then be generated with the following command:
xbstrap run generate-pcap
This will result in a bragi.pcap file that can be opened with Wireshark.
Analyzing the dump with Wireshark
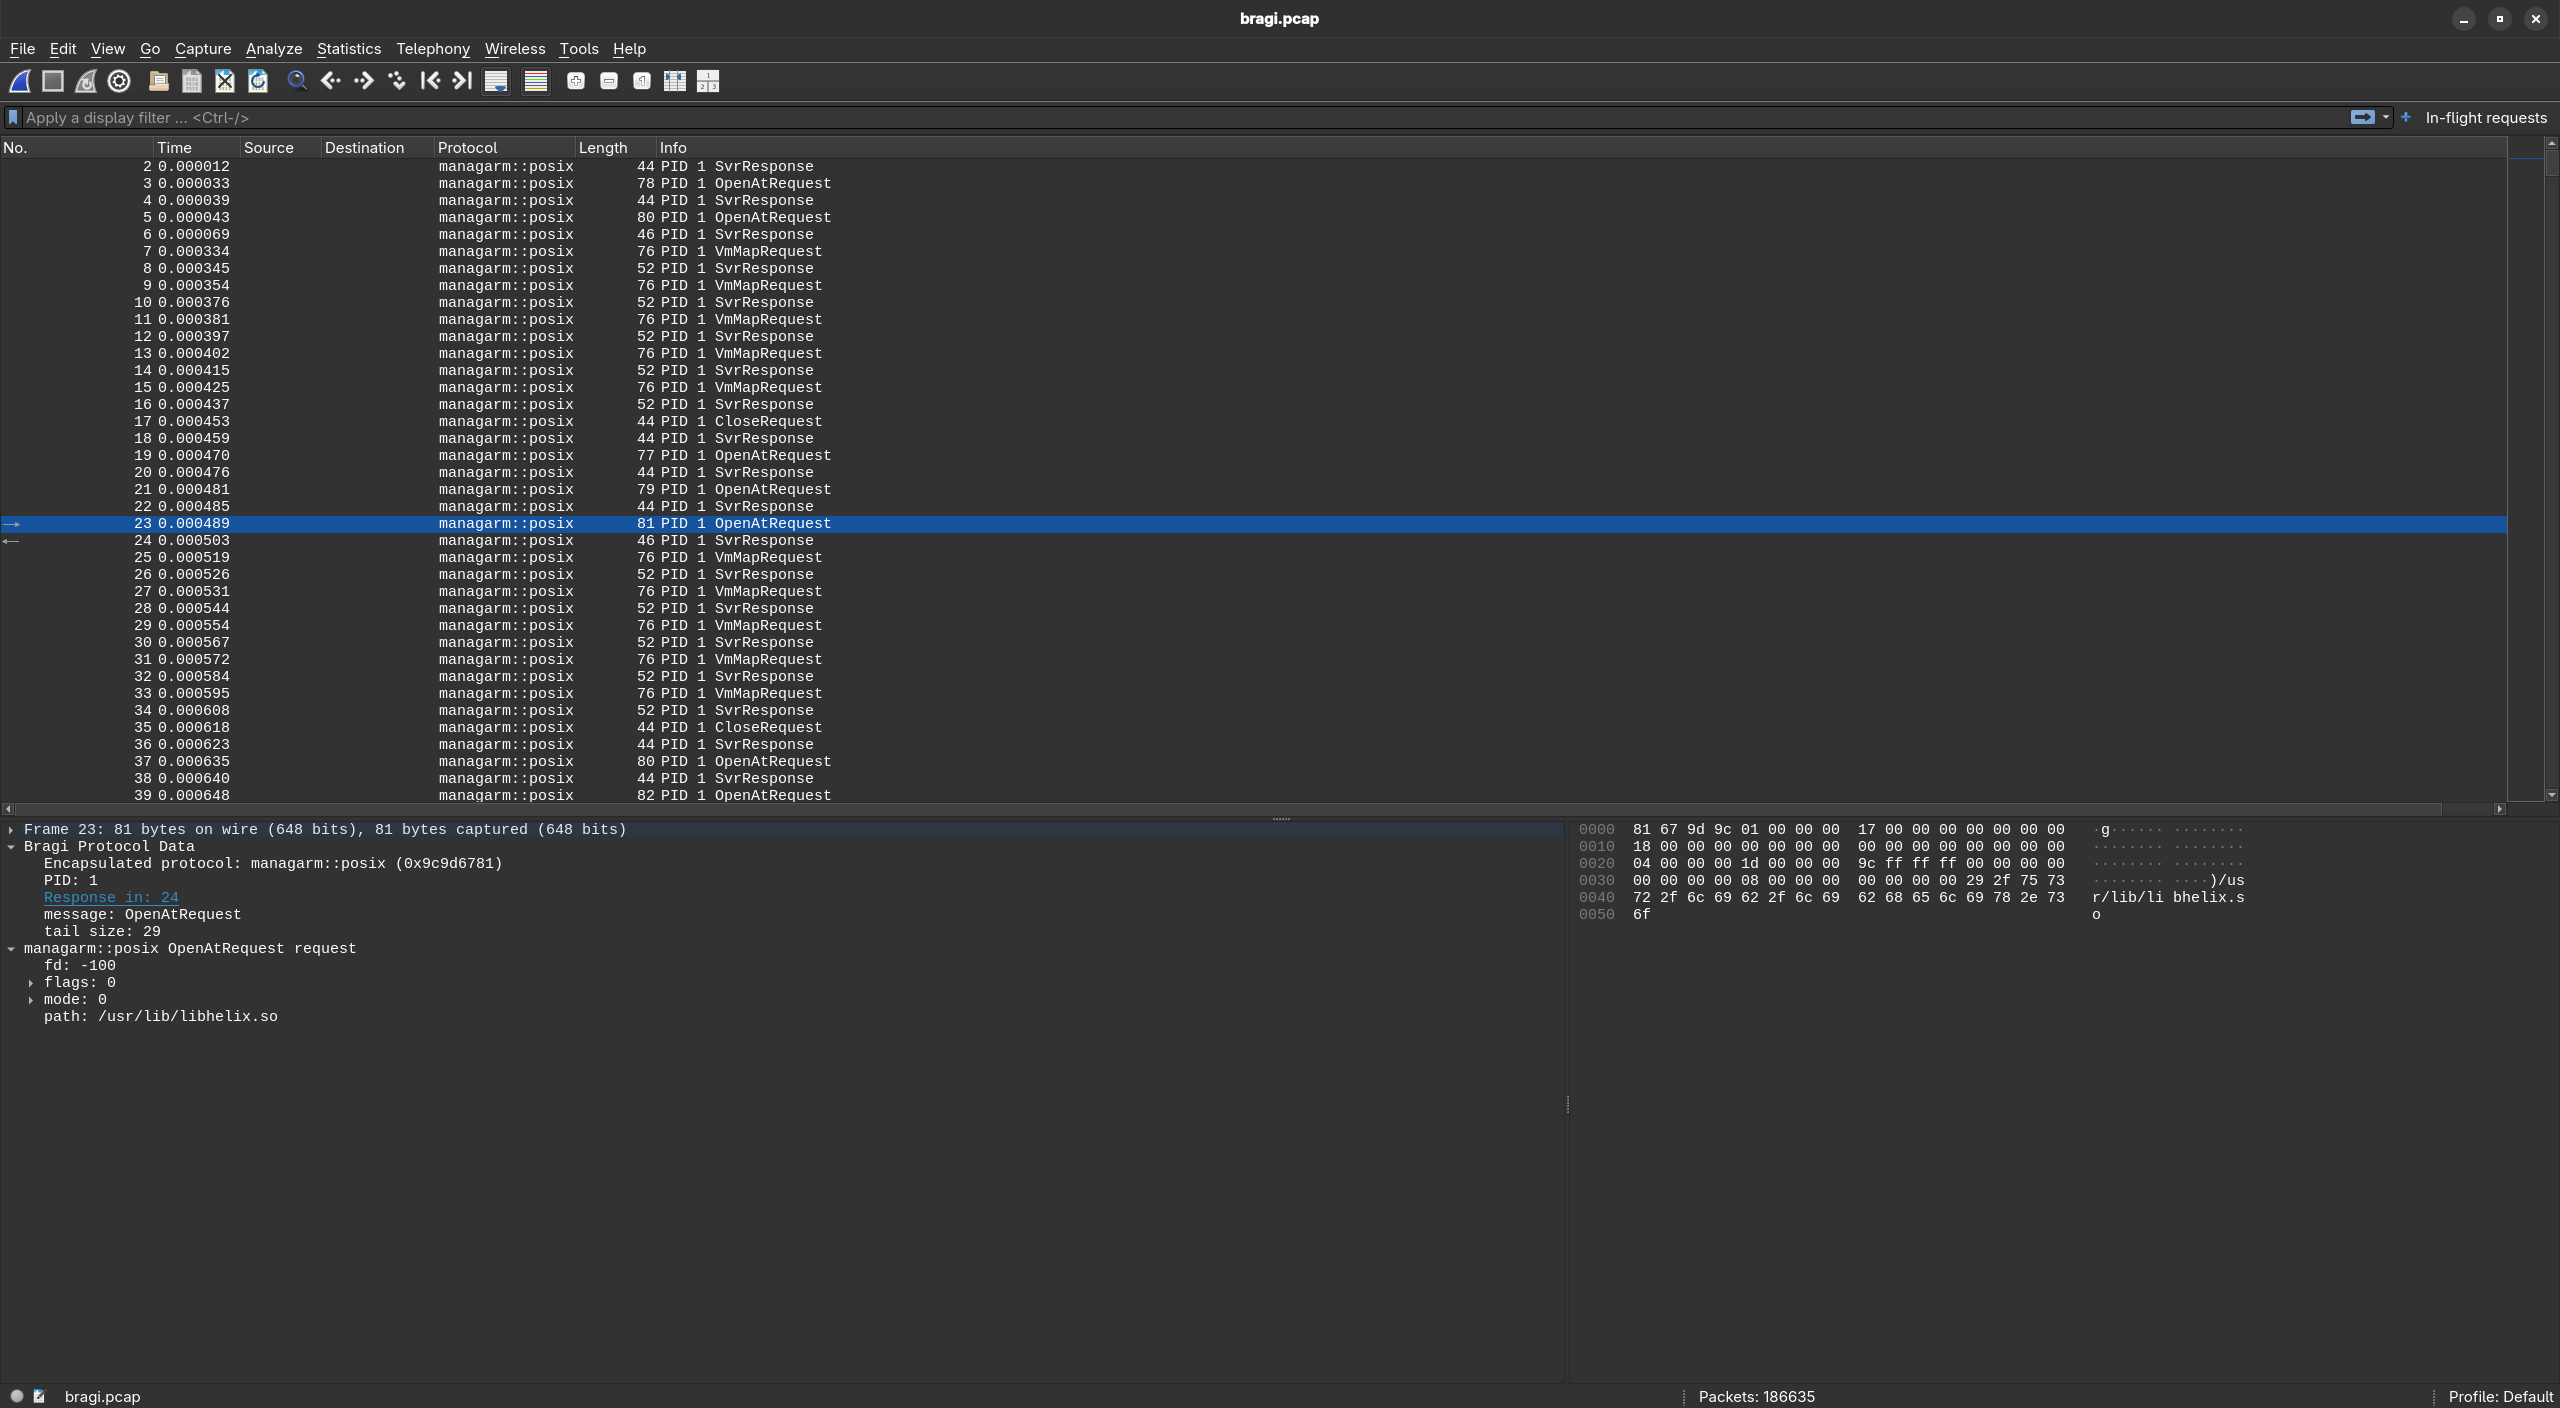
All packets in the pcap include a header that contains some metadata about the bragi message. The details of that can be seen under the Bragi Protocol Data foldable section in the dissector window. Below that, protocol-specific decoding of the messages follows.
For diagnosing hangs, it can be useful to get a view of all in-flight requests. For convenience, this can be roughly filtered with the following expression:
!bragi.reply_to && !bragi.request_of && !fs_ioctlrequest && !fs_initializeposixlane && !posix_netserverrequest
This can be saved as a filter, as can be seen in the screenshot above.